
Our impact
Food rescued. Families served. Resources shared.
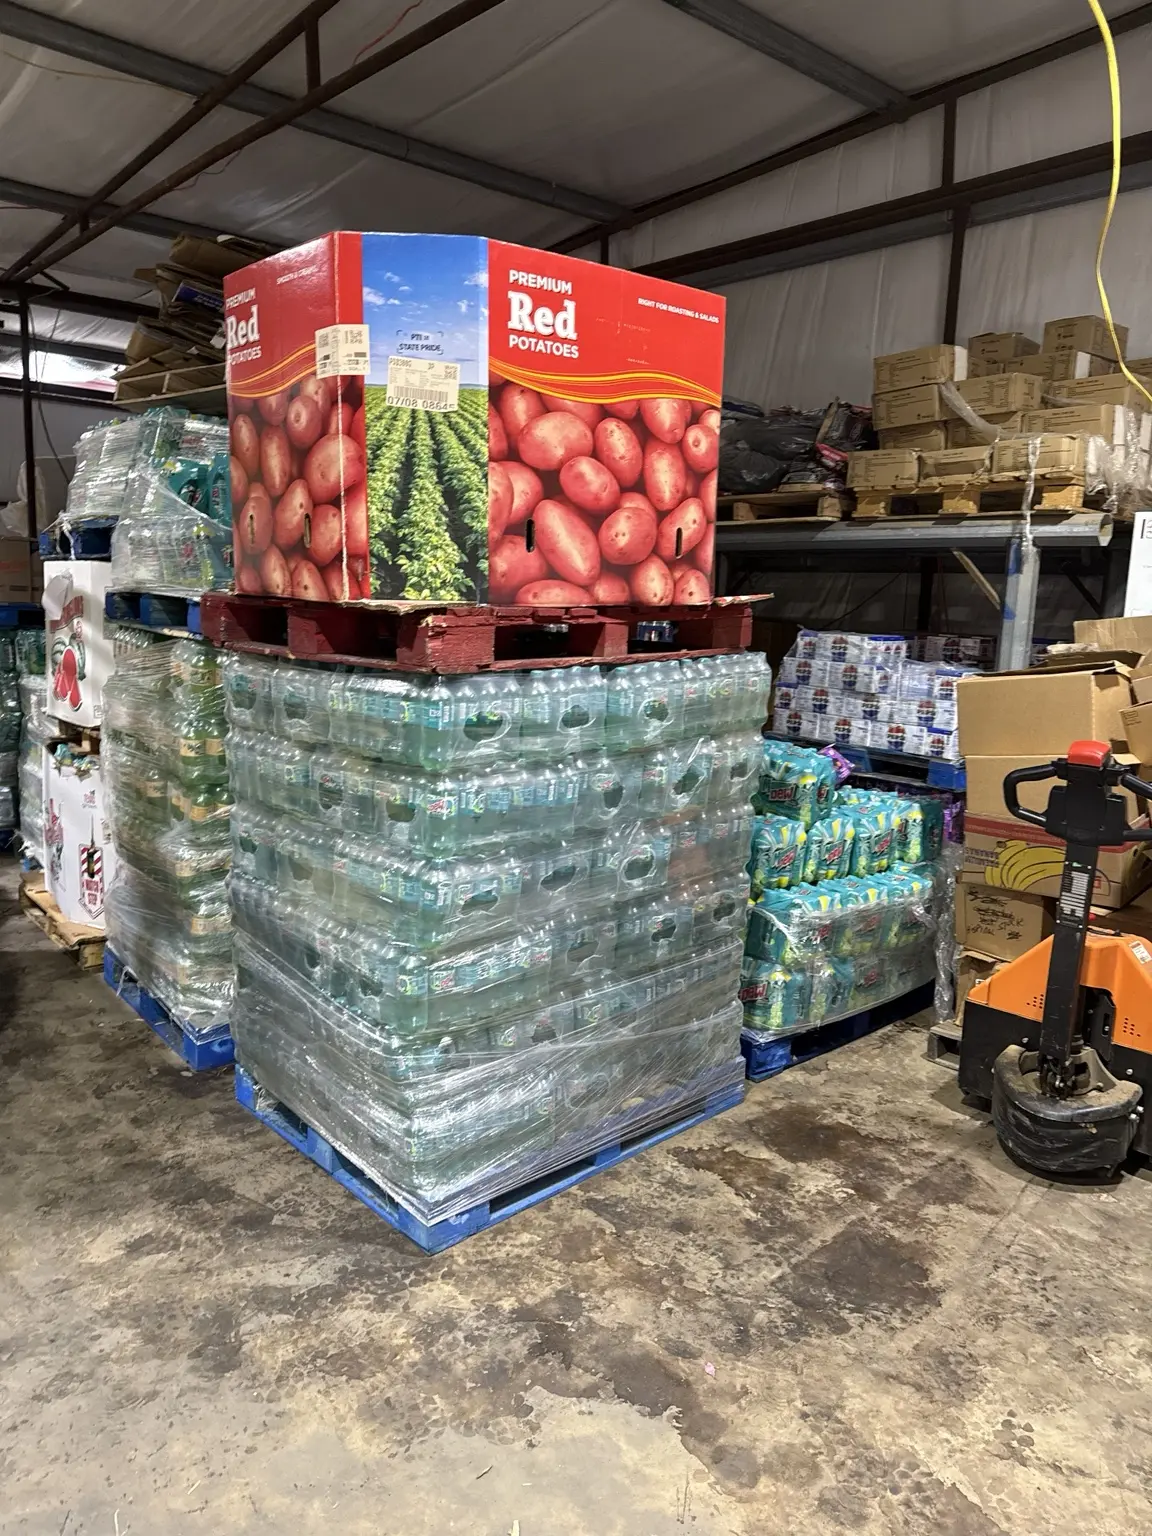
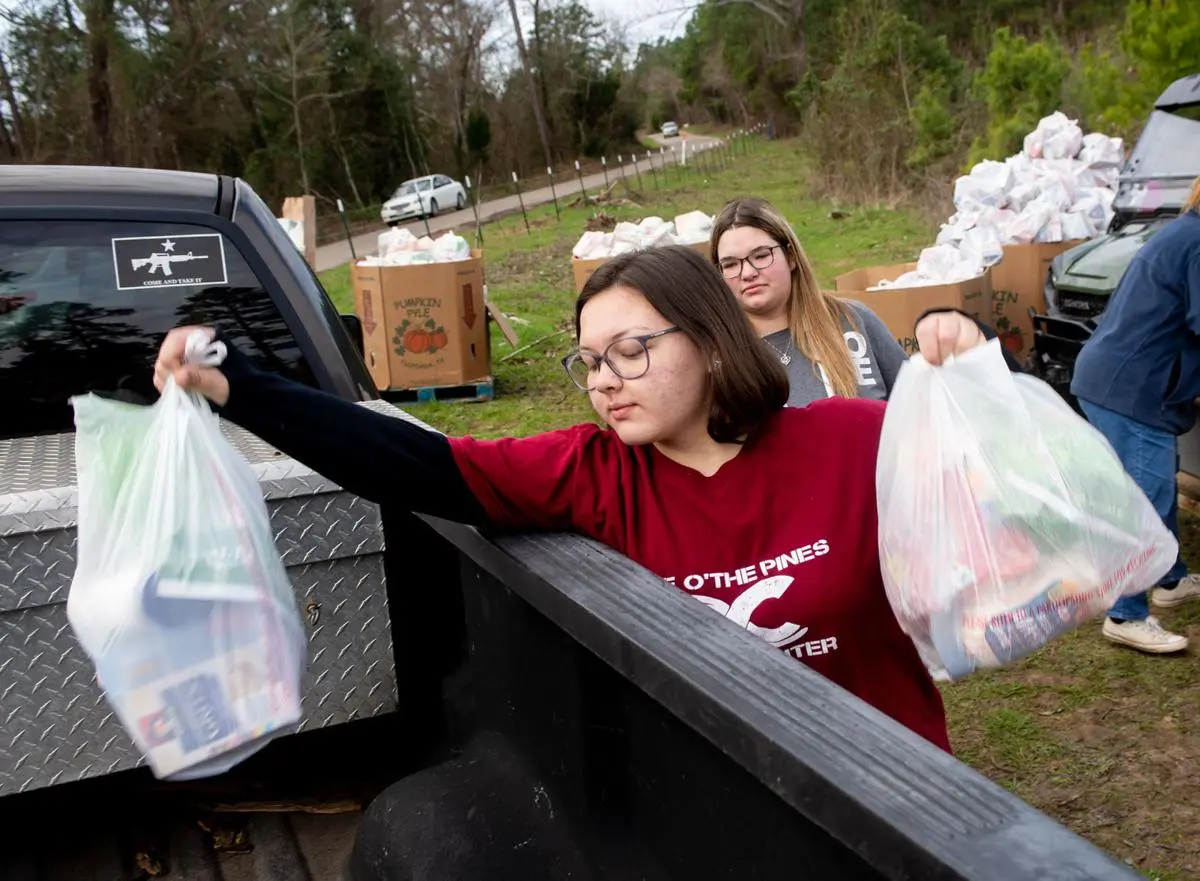
Every pallet, pickup, volunteer hour, and distribution represents real resources reaching real East Texas families.
Latest completed report · October 2026
$127,777.91 in community impact.
September 13–October 10, 2026: estimated local retail value of food and resources shared with East Texas families and community partners.
Estimated retail community-impact values are not cash revenue or expenditures. Family counts refer to the October 10 outreach; they are not a count of unique households across the full cycle.
View the October report and PDFPublished reports through October 10, 2026
$520,427.65 documented across three published reports.
July ($241,242.56), August ($151,407.18), and the September 13–October 10 reporting cycle ($127,777.91) together document $520,427.65 in estimated local retail value shared with East Texas communities.
Measurement note: Dollar figures are estimated retail community-impact values, not cash revenue or expenditures. The $520,427.65 figure is the total of the three published reports through October 10, not an all-period grand total. The $173,475.88 three-report average is descriptive only and has not been used to recalculate the earlier model. January–June remain modeled at the historical July–August basis of $196,324.87; the historical January–August estimate is unchanged and excludes the September 13–October 10 report.
Impact in action
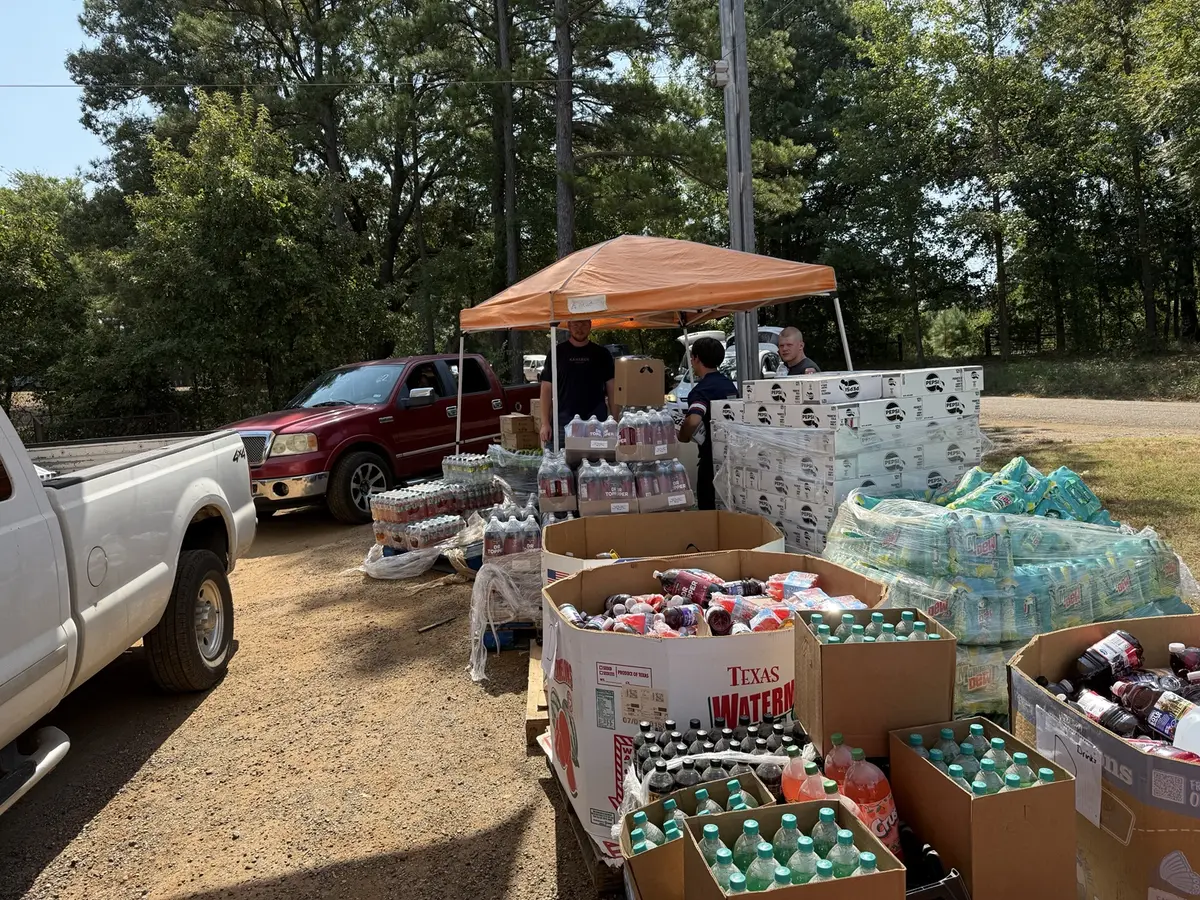
Donations become meals, outreach, and stronger partnerships.
See the month-by-month view, the published community impact graphics, and the July, August, and October reports on our report archive page.
See month-by-month reports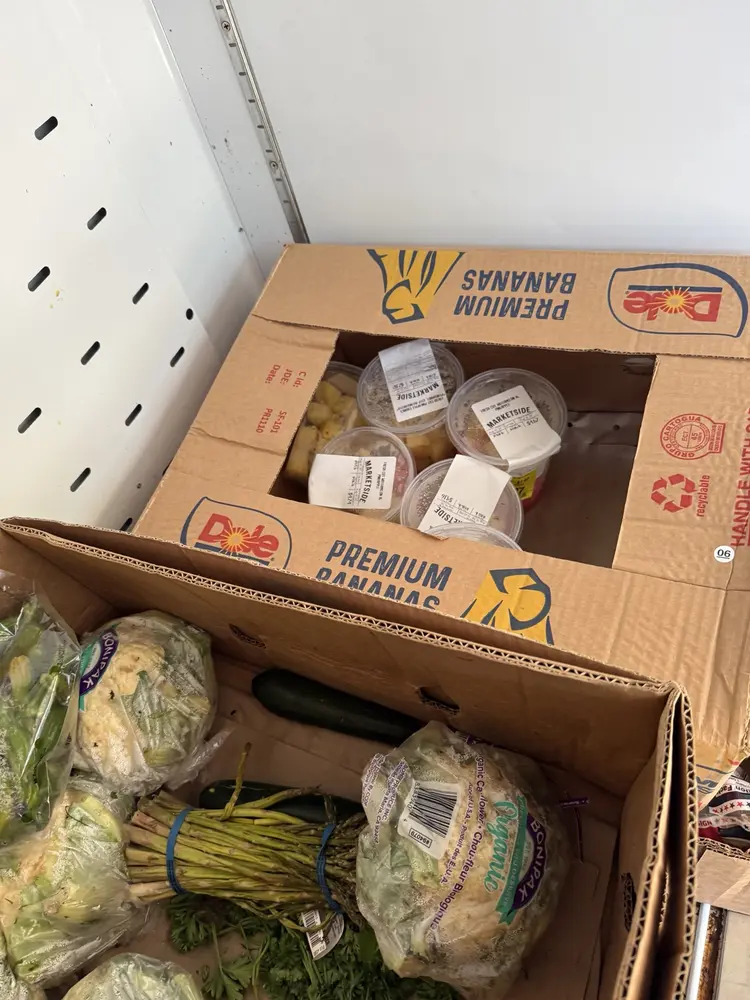
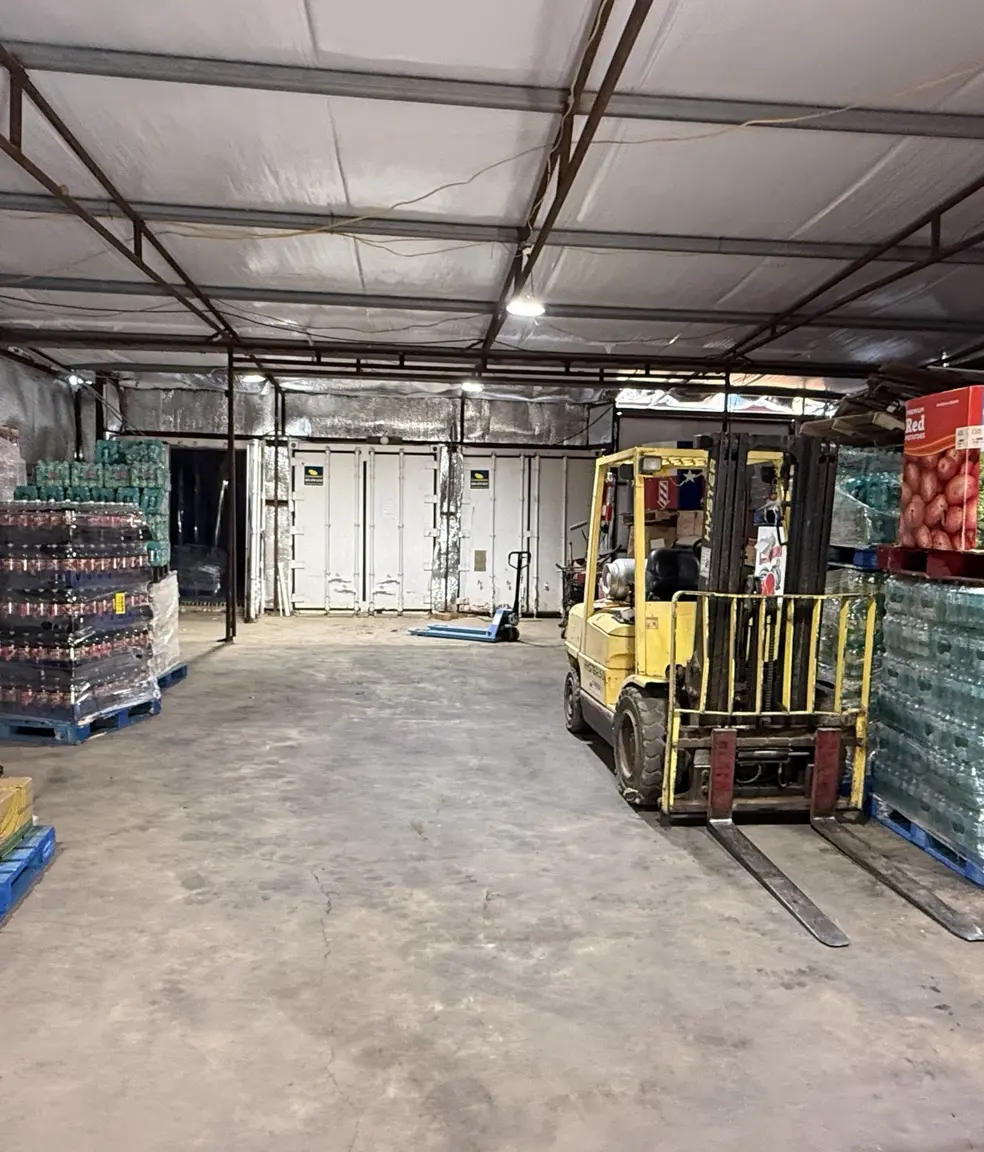
Built to move volume
Cold storage, transportation, and hands-on logistics.
The Dream Center’s current operation can receive larger donations, preserve cold-chain products, and redirect usable food and beverages to families and partner organizations.
- 40-by-60-foot warehouse and semi-truck access
- Two 40-foot container freezers
- One 40-foot combination refrigerator/freezer container
- Three stand-up freezers and a three-door refrigerator
- 30-foot and 26-foot refrigerated box trucks
- Three-quarter-ton van
- Forklift plus manual and electric pallet jacks
A network of partners
Donations travel farther when organizations work together.
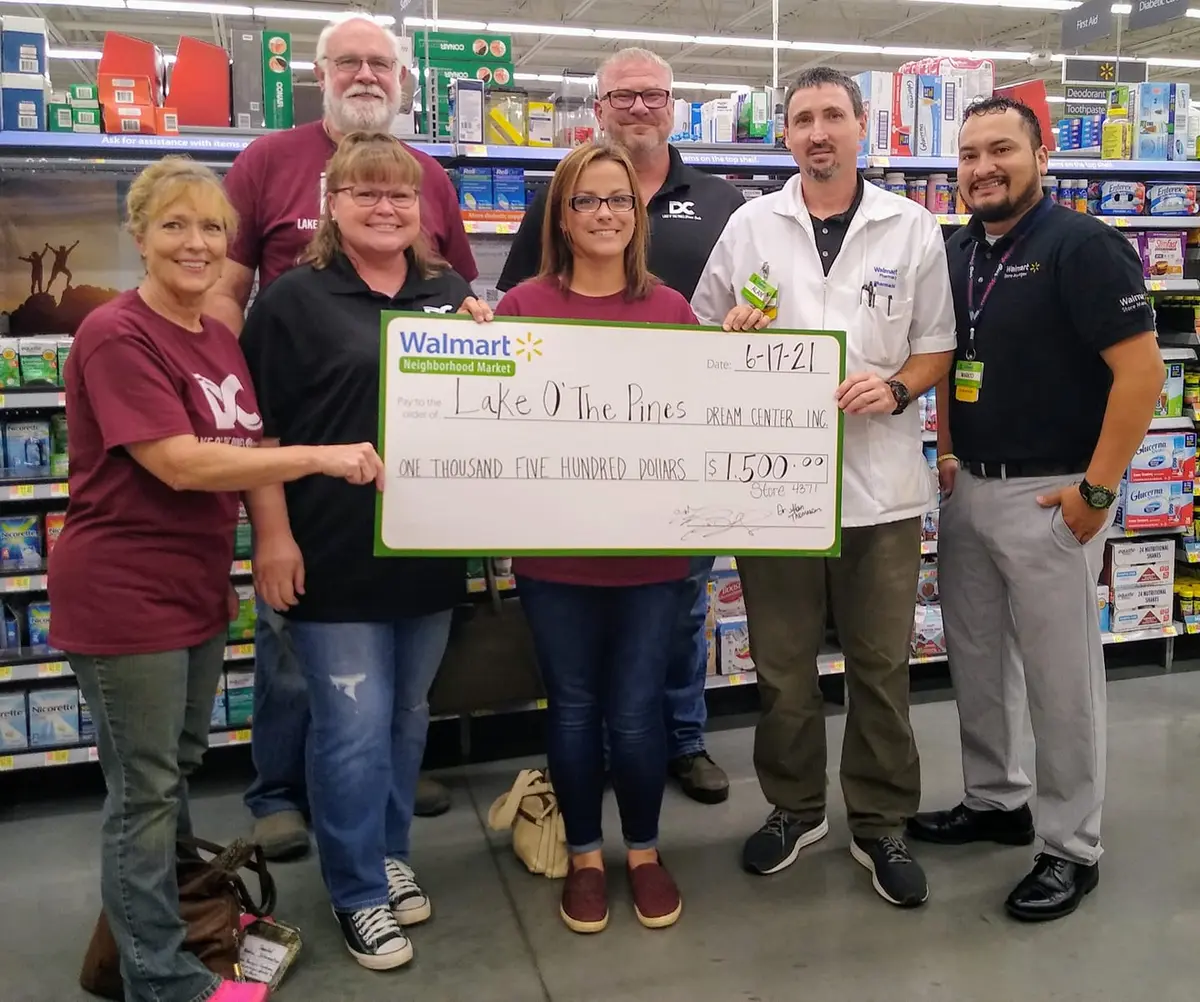
The Dream Center works with regional hunger-relief organizations, distributors, retailers, churches, nonprofits, and community partners to recover usable food and products and move them where they are needed most.
Questions?